How to check CPU & Mem status of micro-services in SCALE
Application detail dashboard
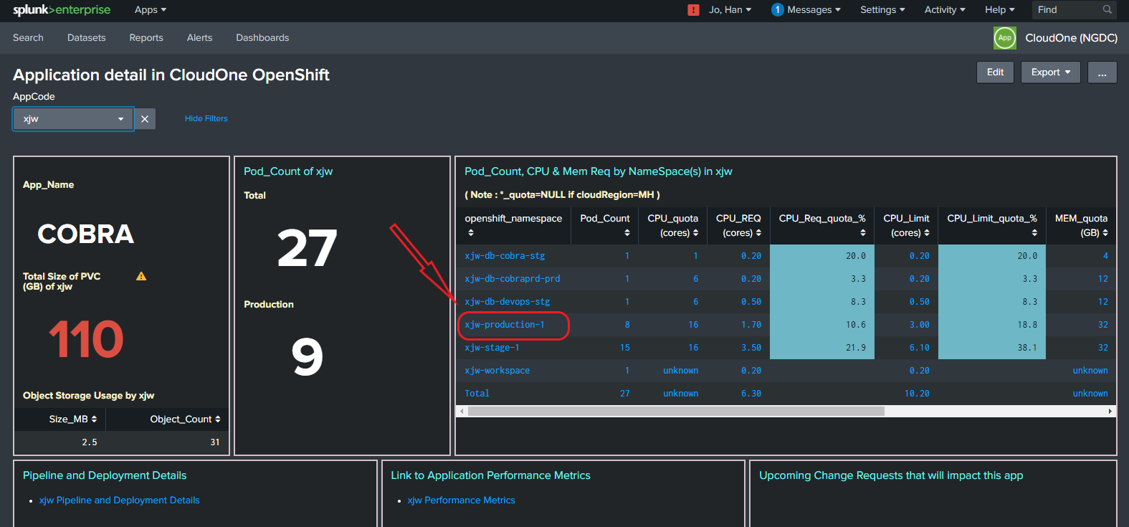
- Go to https://splunk.corp.netapp.com/en-US/app/ngdc/details_of_an_application_in_cloudone
- Click the 'AppCode' dropdown list, and choose the 3-letter-code of your application
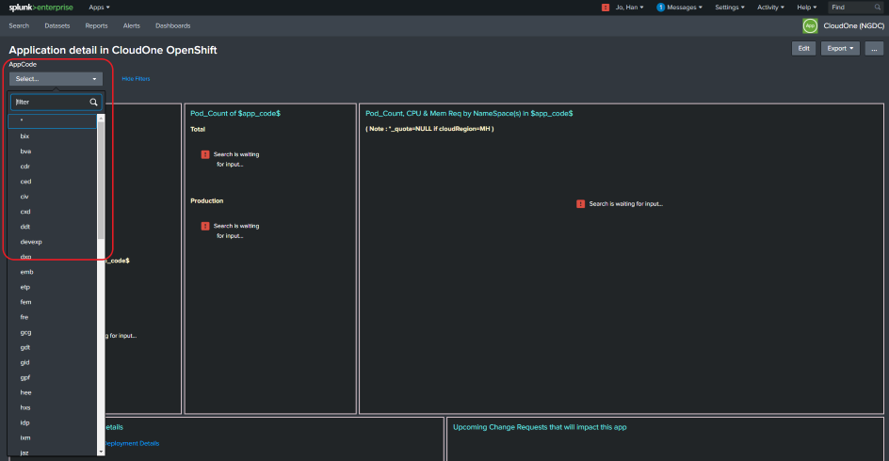
- Click on a NameSpace from the table (a new tab will pop up for 'NameSpace detail by Application in SCALE dashboard)

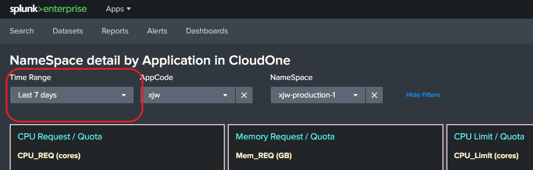
- On the 'NameSpace detail by Application in SCALE dashboard, you can set the Time Range for the data you are interested in.
Default = 'last 7 days', Please don't go over 'last 30 days'
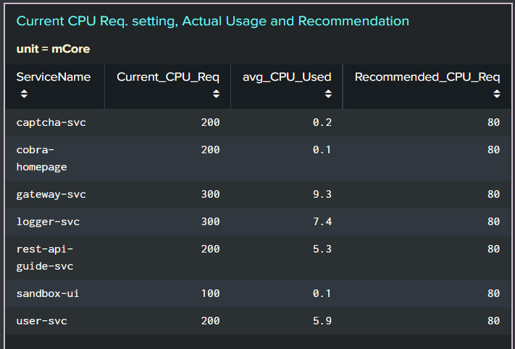
- Scroll down to the panel named 'Current CPU Req. setting, Actual Usage and Recommendation'. This panel shows CPU_Req values currently set in each service's deployment config, actual CPU usage (avg over the Time Range chosen earlier), and recommended CPU_Req value to be set to for each service/deployment.
- Scroll down to the panel named 'Pod and Container stats in
' to see the metrics of each Pod in the NameSpace. avg_CPU_mCore = average CPU usage in mili-Core by the pod, and max_CPU_mCore = usage spike in the Time Range chosen earlier
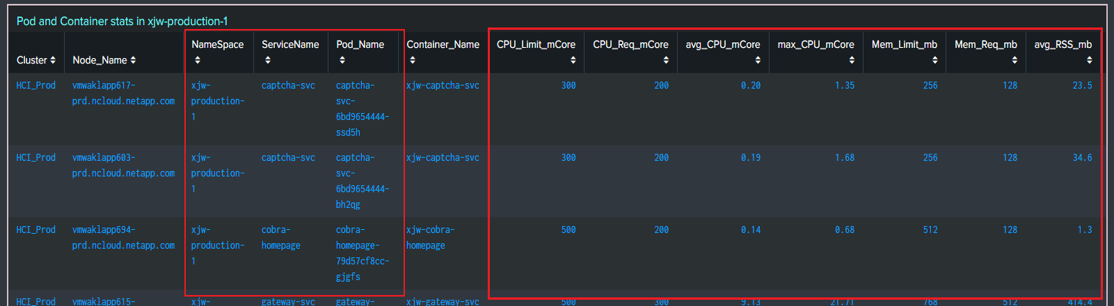
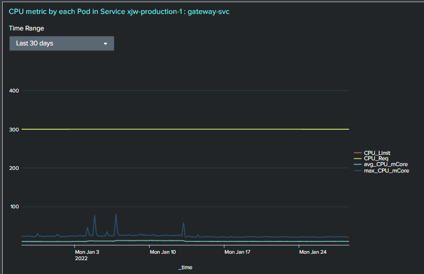
- Scroll further down to the panel named 'CPU metric by each Pod in the NameSpace ... ' to see CPU usage trend by each pod.
- If you want to see the metrics of a specific Service (Deployment / StatefulSet), scroll back up to the panel named 'Pod and Container stats in
', and click on a ServiceName.
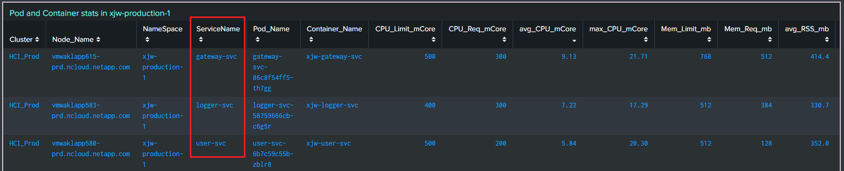
- Another dashboard named 'Service detail by NameSpace in SCALE' will pop up in a new tab. Scroll down to the panel named 'Pod and Container stats in
: ', 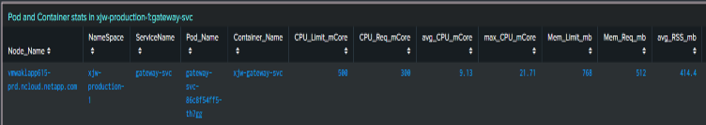 and to the panel named 'CPU metric by each Pod in Service ...' for the trend.